
Automotive manufacturing engineers spend considerable time and effort designing a manufacturing process but in order to ensure the processes are capable and ready to go to production there needs to be a gauge. The process capability index is the statistical calculation that manufacturing engineers employ to assess the statistical capability of the manufacturing process to produce high quality products that stay within the specification limits.
Establishing Process Capability with Cpk
One of the primary tools used to establish process capability is the Cpk calculation with is the measurement of how close your production process is to your target values. The key to this calculation is that it takes into account both variation and distance from the mean in assessing capability which is important because if the mean is shifted significantly there is the chance that the process will go out of control if the variation changes.
Calculating Cpk
 The Cpk statistics calculation begins by identifying the upper specification limit (USL) and lower specification limit (LSL) of the target. For example if your target is 10 mm +/- 2 mm then the USL would be 12 mm and the LSL would be 8 mm. The next step is to take a sample of measurements from a production validation run and measure each sample. Then calculate the mean of the sample by adding all the sample values and dividing by the total number of samples.
Here are your formulas to calculate Cpk:
x̄ = (x-bar) = Average of sample
s = Standard deviation of sample
USL – Upper Specification limit of the part or sample
LSL – Lower Specification limit of the part or sample
Cp = (USL – LSL)/6s
Cpk = min(Cpk USL , Cpk LSL)
Cpk USL = (USL – x̄) / 3s
Cpk LSL = (x̄ – LSL) / 3s
When you have the mean value available the next step is to calculate the standard deviation or σ(sigma). Standard deviation is the square root of the covariance of the sample. To begin, calculate the difference in each sample from the sample mean and square that value then divided by the total number of samples in the population.
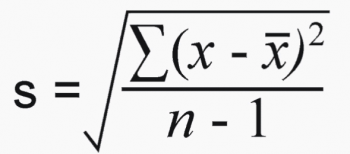
Standard Deviation Formula (for a sample)
The next step in the process is to calculate the Cplwhich is the sample mean minus the LSL then divided by the standard deviation times 3. Then the Cpu is calculated for comparison which is the USL minus the mean divided by the standard deviation times 3. Which value is lower is the Cpk value for the sample.
Analyzing the Cpk Results
When using Cpk results to analyze process capability automotive manufacturing engineers look at the Cpk value and the resulting sigma level that it corresponds too. Below is a sample analysis chart that automotive engineers will use to do Cpk analysis and determine when the process is capable.
Cpk | σ(sigma) | Area under the Probability Density | Process Yield | Process Fallout in defective parts per million produced (ppm) |
| .33 | 1 | .6826 | 68.27% | 317311 |
| .67 | 2 | .9544 | 95.45% | 45500 |
| 1.00 | 3 | .9973 | 99.73% | 2700 |
| 1.33 | 4 | .9999 | 99.99% | 63 |
| 1.67 | 5 | .999999 | 99.9999% | 1 |
| 2.00 | 6 | .9999999980 | 99.9999998% | .002 |
Using Ppkin Manufacturing Processes
The primary difference between Cpk and Ppk is that the first value tells you whether or not the process is capable while the second value looks at how the process is performing over time. When a process is in statistical control then the two values should theoretically be equal.
Using the Cpk and Ppkvalues are essential to keeping an automotive manufacturing process in control so that every product that is produced is high quality with nothing out of specification. As an automotive manufacturing or quality engineer you will utilize these two tools to monitor the performance of your manufacturing process to ensure only high quality products make it out the door to your customer.