
When we bake a cake there is a temperature monitor on the oven to keep the temperature constant for proper cooking or the hot water heaters in homes are set to a max temperature to protect people from burning. There are even limits set on the max temperature coffee can be served at to protect restaurants from lawsuits. Each of these controls is in place to ensure a high quality and safe end product for the user. There are similar tools used by manufacturing to control the products that they build to ensure that they are built correctly and are the highest quality possible. Statistical Process Control (SPC) is the system of tools used by manufacturing operations worldwide to manage a high quality process with very little process variation. By using these tools companies have improved quality and given engineers a means to drive continuous process improvement in manufacturing as they build all levels of products.
What is SPC?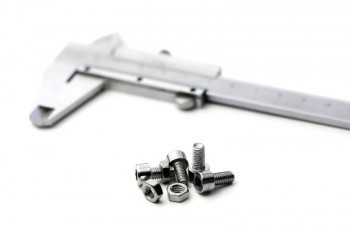
SPC was first though of by Bell Laboratories in the early 20th century around World War I and was first used in Japan during the World War II timeframe when the industrialization of the world was underway in support of the massive manufacturing required to support war efforts. SPC is the process of monitoring manufacturing parameters to prevent poor quality products from being produced.
The basic tool of SPC is the control chart for monitoring that a production process stays within prescribed limits. The chart is built by establishing an upper control limit and a lower control limit then monitoring the key parameter over time so that it stays within the limits. A statistical value called process capability Index (Cpk) Is used to determine how well the process stays within the limits. See the link for how to perform these calculations which are very important in the automotive engineering world.

Figure 1 Control Chart Example
By using the control chart within a manufacturing production line you will gain valuable information as to how your line performs over time and when there are variations in the process. The control chart can then be used to implement quality improvements and avoid quality issues during ongoing production.
SPC production tools
Quality and manufacturing engineers have a variety of SPC tools at their disposal to assist with monitoring the manufacturing process. These tools all center on the control chart and monitoring variation within the process. To establish a control chart for a manufacturing process the engineer must first have a solid understanding of the production process and the limits it must work within to produce a quality process. Second, the process must be developed and stable in order to establish control limits so the manufacturing engineers must have removed all the sources of variation from the process so that it will be stable. Finally, the process must be monitored over time to validate and tweak the control chart so that it works for the process. Once the control chart is in place there are timed reviews and the chart is monitored by the engineering and quality teams.
There are variations to the control chart that can be applied to each manufacturing process and it is up to the team to select the best application based on their conditions. Control charts can monitor variables such as the process range (R-chart) or they can track the process mean (X bar), there are also attribute charts where statistical values are calculated based on production tracked data like the p chart which uses the standard deviation of the process and the total defects over all samples percentage to establish the upper and lower control limits. A c chart will use the number of defects per sample and the standard deviation to calculate the limits. In each case the upper and lower control limit are established for use in the control chart.
With sch a variety of charts, which one woks best? The answer depends on two factors: How accurately you want to track and measure the process and how quickly do you want to detect any changes that occur. The truth is, the most important thing to ensure a quality process is to track the data – Any of these charts will provide an accurate method to determine if you have a stable or unstable process.
Using SPC in the automotive industry
Consider a simple automotive example of a control chart being used in a manufacturing operation. This particular process involves cutting a cable and attaching a terminal at the end of the process. The important parameter that must be met is the overall length. The terminal is a fixed length and the cable is cut to fit from a spool of wire. The engineers know that the specification on the drawing says the total length should be 150 mm with a tolerance of +/- 10 mm. The manufacturing engineers set up a control chart using the tolerances as the safe upper and lower limits. So the control chart looks like this:
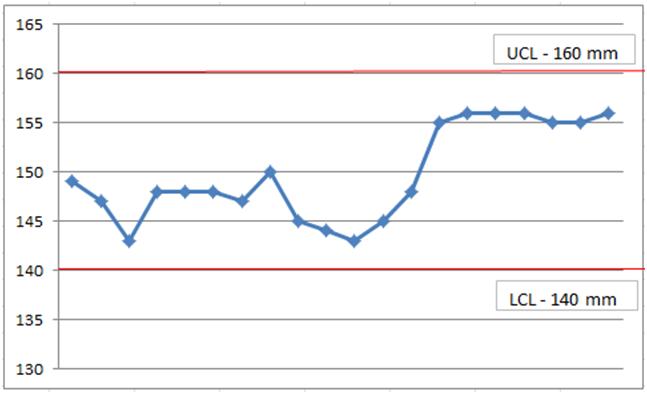 Using this chart they can track the measurements for each part and can notice trends like when the length continues to operate towards the upper control limit and then take steps to bring it back around the ideal measurement.
SPC control charts may seem like very simple and obvious tools but they are really very powerful when applied to manufacturing process. The also fit into larger quality systems such as Six Sigma and the TS16949 Automotive guideline. The key is to establish the correct parameter to monitor during the process and put checks and controls in place to use this valuable information to build the highest quality products possible.